The world of trading has various terms, one of which is the divergence pattern. Divergence is a trading signal that is favored by various traders because it has a fairly accurate value.
Therefore, traders often look for this pattern as a reference for trading decisions. For those of you who are curious, let's see the discussion below!
Also Read: Get to Know USDT, a Stable Asset in Crypto!
Get to know Divergence Patterns
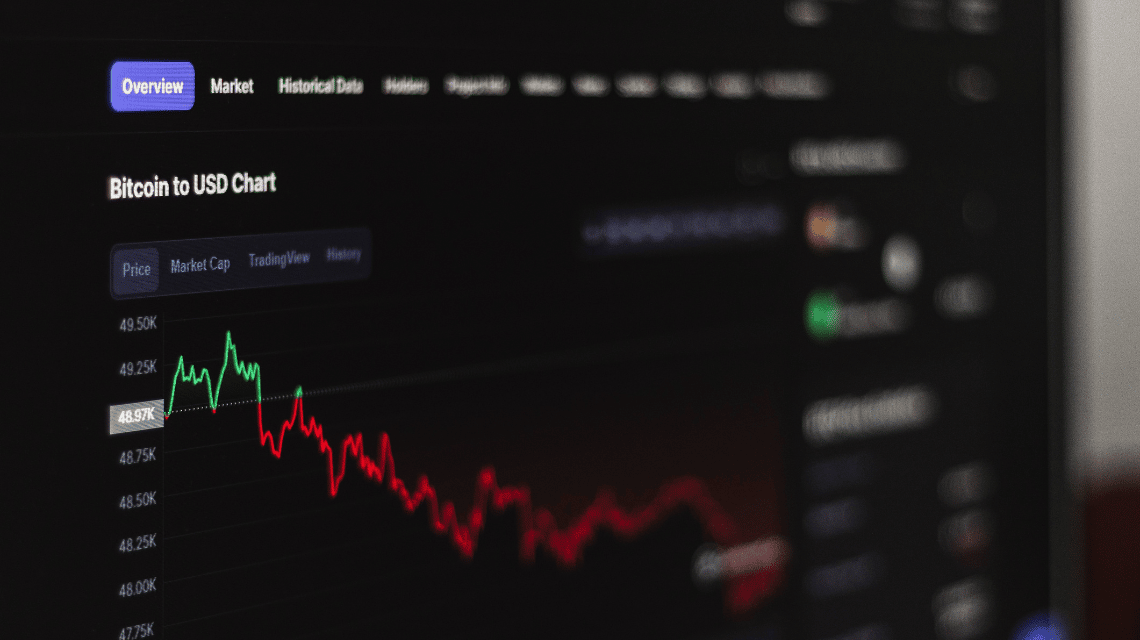
Divergence pattern is a pattern in trading that uses signals of differences in price movements on the chart with price movements in indicators.

IDR 50,00062%
IDR 18,900
The indicator for this divergence technique is usually the RSI, Stochastic Oscillator, and MACD.
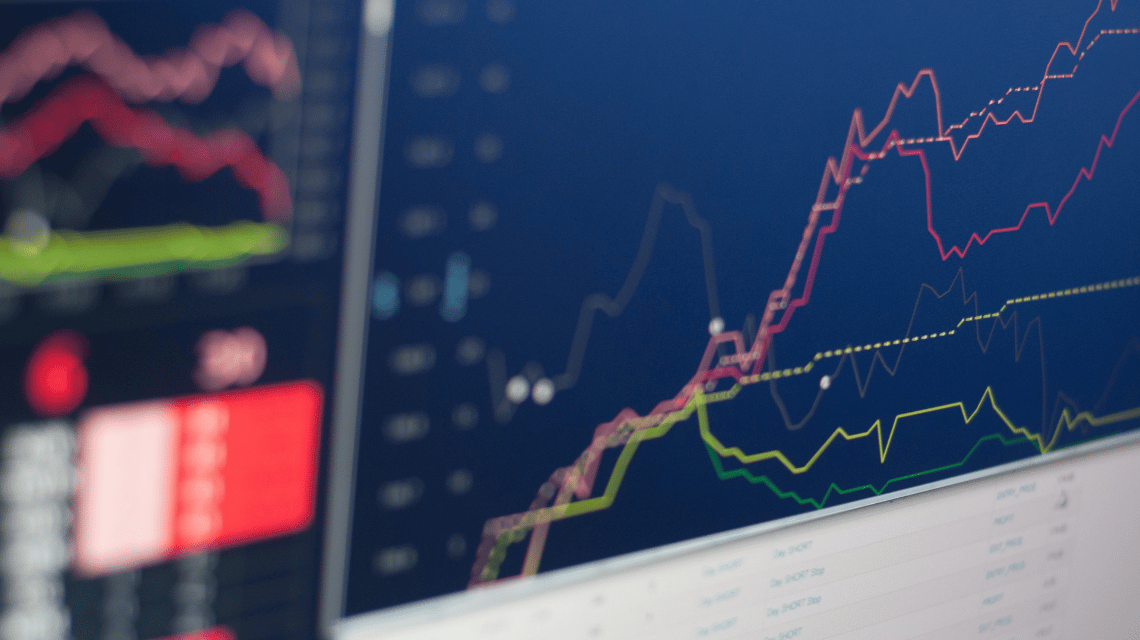
Price movements on indicators and charts have the same level and direction. If the price reaches a higher point than the previous candle, then the indicator must also reach a higher point than the previous candle.
If the price of the indicator and the chart move differently, then you can be sure that there is potential for a change.
So, a trader can see whether the trend will continue or not with the divergence technique. With this technique, traders can see a weakening or potential trend.
Also Read: Crypto Trading Tips You Should Know
Types of Divergence
There are two types of divergence, namely Regular Divergence and Hidden Divergence. The following is an explanation for both types.
Regular Divergence Patterns
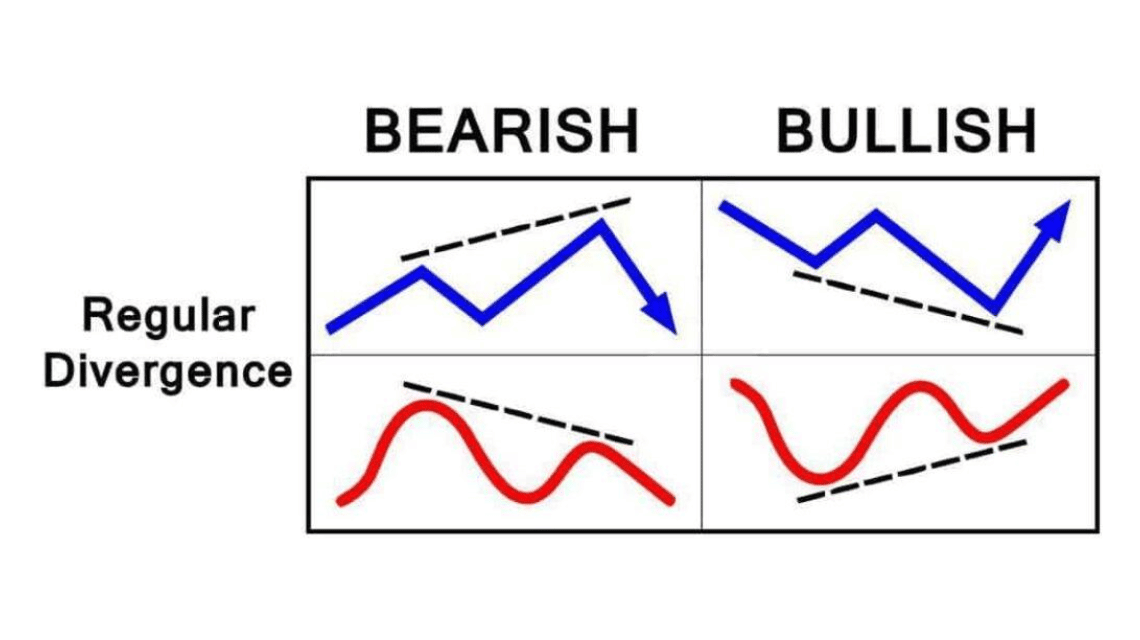
First, there are regular divergences which are signs to indicate a trend reversal.
There are two regular divergences, namely regular bearish divergence and regular bullish divergence.
Regular Bullish will occur if the chart price is in a lower low position and the indicator is in a higher low position.
This sign is an indication that a trend reversal or reversal, from a downtrend to an uptrend, namely bullish.
In addition, regular bearish will occur if the price chart is in a higher high position and the indicator is in a lower high position, indicating a reversal of the trend up to down or bearish.
Also Read: Ethereum Trading Tips for Maximum Cuan
Hidden Divergence Patterns
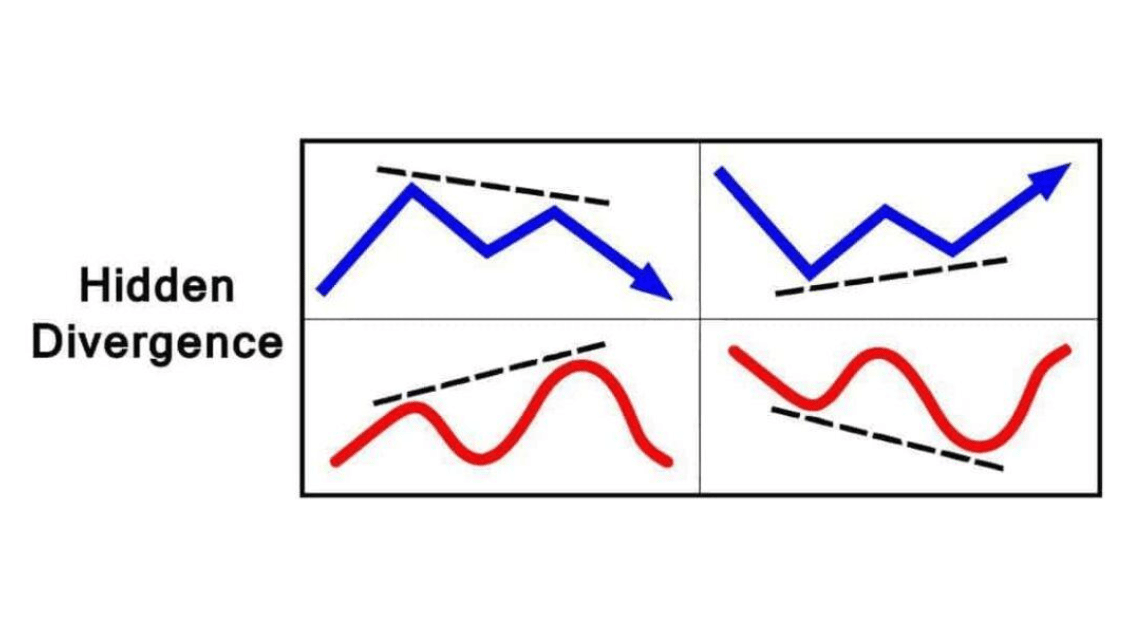
The second type is hidden which gives signs for the trend to continue. There are two hidden namely hidden bullish and hidden bearish.
Hidden bullish can occur if the chart price is in a higher low position and the indicator is in a lower low position. If there are these signs, then the bullish trend is taking place and will continue.
The last type is hidden bearish: price chart positions lower highs and indicators position higher highs. You can identify these signs and mean that the bearishness is in progress and may continue.
Thus the discussion of divergence patterns and two types of divergence.
VCGamers has released a crypto asset under the name $VCG Token which operates on the Ethereum network (ERC 20) and Binance Smart Chain (BEP 20).
$VCG Tokens has been officially registered at Bappebti or the Commodity Futures Trading Supervisory Agency and the Indonesian Ministry of Trade as crypto assets traded on the physical crypto asset market.
Currently, $VCG Token has been listed on various CEXs or Centralized Exchanges and DEXs or Decentralized Exchanges namely Pancakeswap, Uniswap, BitMart and Indodax.
Not only that, $VCG Token is the official currency in the first metaverse in Indonesia, namely RansVerse with the collaboration of VCGamers, RANS Entertainment, Shinta VR, and UpBanx.
Follow along Update $VCG Token only in VC News.